/* Blockchain trade letter march 2017…exclusive publication from republic by conspirators*/
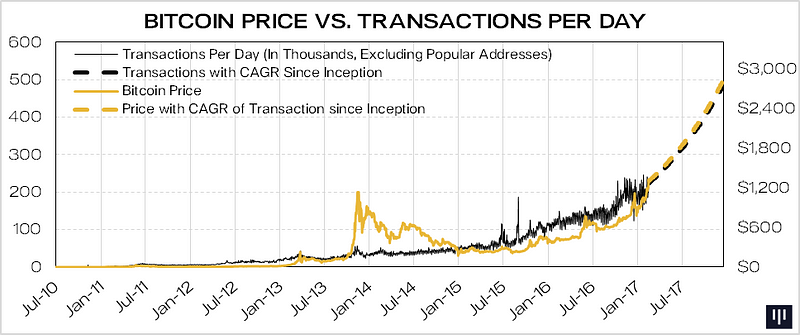
As the price of bitcoin surpasses all-time highs, we feel it is important to consider how the overall health of the bitcoin network compares to the previous high in 2013. One of our favored metrics — transactions per day on the Bitcoin network — is up 4.6 times the level in late 2013, as shown on the below graph.
With the notable exception of the bubble in 2013, the price of bitcoin has appreciated apace with the growth in transactions.
(The growth rate in the number of transactions is being curtailed as the smallest transactions are being forced off the blockchain. Our intuition is that the value of transactions is still growing at roughly the same rate. This warrants further research, which we will publish in coming months.)
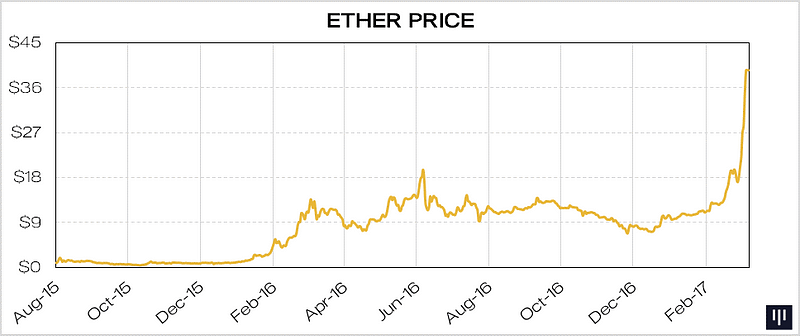
ETHEREUM PRICE SOARING
The digital asset markets generally have been performing very well over the past six months. In particular, the price of Ether has been one of the best performing during this period. Ether is up 388% year-to-date with a total market capitalization of $3.6 billion.
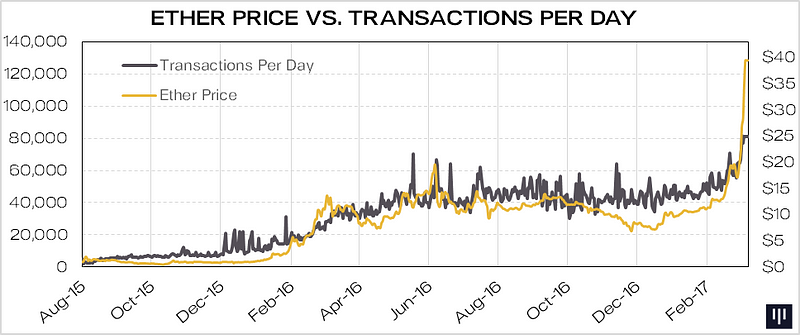
As with bitcoin, the value of the protocol’s native currency is closely correlated with the usage of the technology. The graph below displays the price of Ether compared to daily transactions on the Ethereum network since inception of the protocol.
BUY RECOMMENDATION AT $270
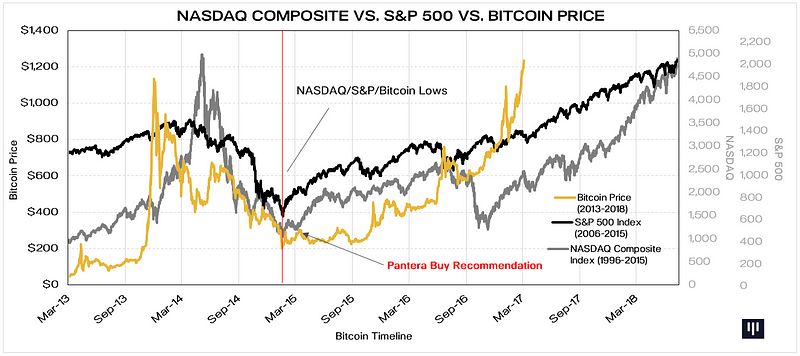
In March 2015, after a fifteen-month decline, we felt the price of bitcoin had reached the lows and was likely to begin to rise due to improved fundamentals. We issued one of only two trading recommendations Pantera has made — BUY at $270 /BTC. We published our rationale in our Blockchain Letter and a special Forbes article.
We felt the price may be displaying the telltale signs of a bottom with extreme bearish sentiment, ignored improved fundamentals, and indications of selling exhaustion.
In the article, we discussed the relationship between the bear market bottoms of the S&P 500 in 2009 and the NASDAQ in 2002, and the similarities they may have had with the bitcoin bear market over the preceding 15 months.
“Six years ago this week, the question heading Nouriel Roubini’s weekly Forbes column — and the question on the mind of virtually every investor — was “How Low Can The Stock Market Go?”. You all remember it. On March 9, 2009, the S&P 500 fell below 700 for the first time in 12 years. Goldman Sachs published a research report warning that it could fall as low as 400.”
We go on to describe the performance from those lows to March 2015.
“The NASDAQ composite topped 5,000 on March 2nd, up 350% from its 2002 low. The S&P 500 is up 210% from its 2009 low…today bitcoin presents an even more compelling opportunity than it did 16 months ago.”
Pantera’s recommendation proved prescient. Bitcoin has returned over 350% since we published the recommendation (similar to the price appreciation experienced by the NASDAQ and the S&P 500 off their lows).
“I work with bitcoin every day, and I’m the first to admit that it is still an awkward teenager — maybe even an ornery toddler. After all, it is just six years old. But when I look at Bitcoin’s venture capital investment — more than the internet at a similar age — increased developer interest, its growing merchant and user adoption, and generally favorable comments by regulators, it’s clear that its long-term prospects are stronger than ever. There is no proven way to time markets. But if time travel were possible, wouldn’t we all like to go back to invest in equity markets at historic lows? The question is, if we had a crystal ball to allow a peek at the world in 2025, would we kick ourselves for not investing in bitcoin today?”
DIGITAL CURRENCIES OVERBOUGHT
The reason to mention our penultimate recommendation is that we have a sense that digital assets are overbought right now. Today’s euphoria over bitcoin, ethereum, and every token sale is the (bi-?)polar opposite of the dejected depression when bitcoin was at $270. Each counterpart to the bullish signals in our Forbes article is maxed out the other way — wild bullishness at the highs, the price well above the fundamentals, and dozens of new tokens surging simply on the announcement of their vaporware.
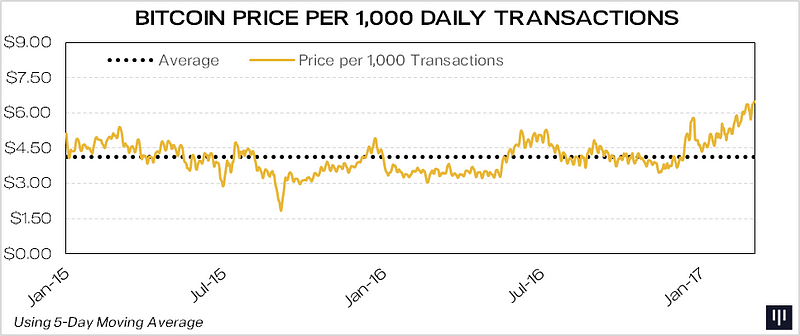
Let’s check fundamentals. The relationship between bitcoin price and underlying transactional use has been so close that the ratio is fairly stable. (In 30 years of trading currencies, I can’t recall many currencies where the fundamental drivers are so clear and stable.) The graph below shows the ratio bitcoin price per 1,000 daily transactions — essentially what the market is willing to pay to own a share of the protocol for every 1,000 transactions. This may be a helpful guide to determine the short-term valuation in relation to fair value. Currently the price is trading above the high-end of this range, which has predominantly traded between $3.00 and $5.00 per 1,000 daily transactions. At a price of $1,257 it is 2.8 standard deviations from the mean.
This may be helpful to a short-term trader for timing when to buy or sell — or for those entering a long-term position.
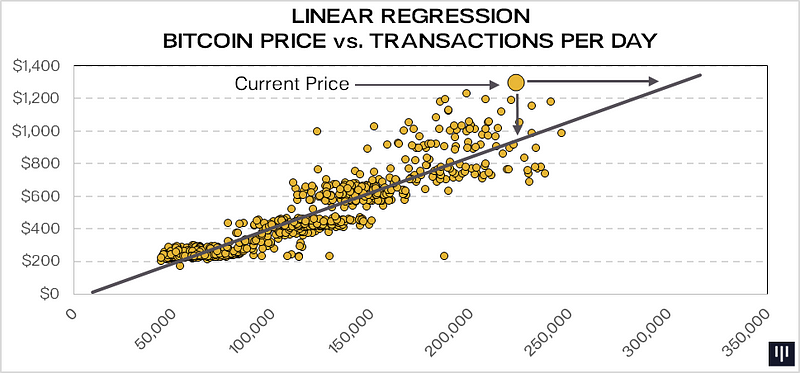
The graph below can put the current price in prospective. It displays a linear regression of the price of bitcoin to the number of transactions in the Bitcoin network per day. Since January 2015 the price of bitcoin has a stable positive relationship with confirmed transactions per day. At the current transaction rate (222,994), one would expect the price to be $986 /BTC.
For this relationship to move back in line with the expected values based on the regression line either the price would need to fall 22% to $986 or drift until transactions have grown 33% to reach 295,509. Based on the average annual growth rate, daily transactions are expected to reach a level corresponding to the current price on June 21, 2017.
Disclaimer — For many years I’ve said bitcoin’s going to $25,000+. When it gets there, don’t go saying “You were bearish at a thousand, man.” This is a short-term trading view that the market is ahead of itself — it’s likely to stagnate for a period of months.
Annual transaction growth has compounded at an average rate of 105% for the years 2012 through 2016. Bottom line: the honey badger of money will get right back up. Mt.Gox, multiple dramas, ETF rejection, etc.
Putin’s Personal Trader Exposes How To Turn $10 To $100K Renegade Russian Analyst Reveals How To Turn $10 To $100K Have you seen this viral video? The Cryptocurrency Institute have released a video show casing the methods a Putin’s Cryptocurrency Traders uses to generate 10,000% ROI! [Click here to watch this before it’s taken down] This is shocking. I didn’t believe this myself until I saw it. See for yourself. It will blow you away.
Putin’s Personal Trader Exposes How To Turn $10 To $100K Renegade Russian Analyst Reveals How To Turn $10 To $100K Have you seen this viral video? The Cryptocurrency Institute have released a video show casing the methods a Putin’s Cryptocurrency Traders uses to generate 10,000% ROI! [Click here to watch this before it’s taken down] This is shocking. I didn’t believe this myself until I saw it. See for yourself. It will blow you away.
“HYPERLOOP”- THE GLIMPSE OF FUTURE OF TRANSPORTATION “If you are bold and strong with your determination the entire world will come up and accept you”—This is the sentence told by my friend, vineeth this evening. Yes, as I feel it’s true writing this article about my favourite project of Tesla that is “HYPERLOOP”. Firstly, let me introduce you the idea of HYPERLOOP :- HYPERLOOP the word itself holds some power of transforming from the way we are yes , this idea is meant to transform the transportation system. The idealist behind it is the great “Elon Musk”. The basic idea of hyperloop is like the pod which contains passengers, travels at very high speed using magnetic levitation in a tunnel with partial vacuum. This the super-fast way of transportation which will be driven using electric motors. Confused, let me explain see, pod is like aerodynamic aluminium capsule like structure encapsulated with a tube surrounded by a cushion of air that...
IS Mr.Donald trump the maddest bad player? -Raghava NO, NOT COMPLETELY . Though the world has not understanding he is righteously committed to the welfare of united states of America and the latest immigration system of America has been proving it. US president Donald trump pushed for a merit based immigration system that could benefit high tech-professionals from countries like India. Trump, during his first address to the congress, noted that “Nations around the world, like Canada, Australia and many other countries have a merit based immigration syst...
Hyderabad the best among the Indian Cities RAGHAVA Mercer, the world’s largest human resource consulting firm Headquarted Newyork has announced the latest survey and ranking on quality of living index in which our Hyderabad ranked 144th spot in the world. T he survey has just deduced the fact that most Indian cities are below the international standards in terms of quality of living at the level of people’s satisfaction. The survey says that Indian cities are progressively doing well but when it comes to global index it is relatively low. Though, Hydreabad ranks top in India it slips from 139 to 144.The other Indian cities are also ranked low such as Delhi in 161,Mumbai 154,Pune 145,Bengaluru 146,Kolkata 149. ...


Putin’s Personal Trader Exposes How To Turn $10 To $100K
ReplyDeleteRenegade Russian Analyst Reveals How To Turn $10 To $100K
Have you seen this viral video?
The Cryptocurrency Institute have released a video show casing the methods a Putin’s Cryptocurrency Traders uses to generate 10,000% ROI!
[Click here to watch this before it’s taken down]
This is shocking.
I didn’t believe this myself until I saw it.
See for yourself.
It will blow you away.